Biotech Valuation
In today’s post I’ll be looking at biotech valuation and playing around with research agents. I’ve always been interested in the business of biotech, and this was a great opportunity to see if agents can handle some of the heavy lifting involved in company valuation. I should note at the outset that I am in no way an investment or clinical trial professional, and all of this is merely for illustrative purposes.
In this post I’m taking a simple example, looking at the valuation of a hypothetical biotech developing a single asset. Of course, the reality is often more complex - biotechs may be developing multiple drugs simultaneously, or they may be working on a platform that will have tremendous inherent value, just to name a few. All of the code can be found here if you’d like to follow along.
DCF basics
Discounted cash flow (DCF) analysis is a time-tested methodology to assess the value of a given company. The core model is deceptively simple: you forecast the future cash flows that the business will accrue, discount these based on the price of capital (because investors want to see a healthy return) and on how far in the future this revenue occurs (after all, a dollar today is worth more than a dollar next year), and you arrive at a net present value estimate. How does that apply to biotech, though? While businesses in most other industries have cash flows that are reasonably predictable, revenues for a biotech are many years and several clinical trial phases removed from actually materializing at all. Turns out there is a method that accounts for these exact risks: the risk-adjusted NPV. Because there is inherent uncertainty in each step of the clinical trial process, any subsequent step is adjusted by the probability of that step actually occurring. Assume your compound is currently in phase II. If your phase II outcome turns out to be negative in a few months time, the project will likely be halted, which not only means that it will not generate any revenue, but also that it will not incur the costs of a phase III study. For a drug to actually start generating revenue, it has to successfully undergo the different phases and be accepted by the regulatory bodies like the FDA or EMA. This total probability of approval is therefore applied to the expected revenues of the asset.
As you can tell from the paragraph above, the DCF features a lot of assumptions and judgment calls that one has to make to arrive at a final estimate. DCFs are sometimes criticised for being “precisely wrong”: they provide the user with very specific numbers that create a false sense of certainty. Much as in machine learning, the principle of garbage in-garbage out holds true. The nice thing is that the DCF forces you to write all these assumptions out explicitly, and that they can be scrutinized easily. That could make this an interesting problem for agents - they can theoretically digest large amounts of information to arrive at answers, and we can double-check their reasoning and answers easily. Let’s now look at what we actually need to provide for our model to make sense. First, we need to predict how our clinical trials will proceed.
Parameters aplenty
The first set of parameters we need are the phase transition probabilities. Development starts in phase I where safety and PK are primarily evaluated, followed by phases II and III where efficacy is the main question. After Ph III either a Biologics License Application (BLA) or a New Drug Application (NDA) is composed and filed, which is then finally (hopefully) approved. Each of these transitions is associated with a certain failure rate, impacting the probability - and risk-adjusted value - of all downstream events. These probabilities also vary wildly by therapeutic area: neurology is for instance extremely challenging with a 6% overall success rate, while hematology sports a whopping 24% success rate. These differences are often a reflection of our biological understanding of the disease processes we are trying to modulate: hematology is dominated by Hemophilia A and anemia, both well-understood, well-characterized illnesses, while our understanding of neurological diseases, be it Alzheimer’s, Parkinson’s or depression, is much more limited. Trial duration, number of patients required to enroll and associated trial costs also vary across domains. We’ll need to retrieve all these parameters and tabulate them in a convenient format. That’s a decent amount of work, but luckily we can offload the lion’s share of this work to our trusty agent Claude Code. I asked Claude’s Opus 4.5 to tabulate all this data, drawing from reliable sources like BIO, FDA, or academic studies on large datasets. Some time and a healthy amount of tokens later, Claude provided me with clinical_trial_reference_data.json, tabulating all the information we need to make an educated first guess regarding the expected costs, duration and success rate of the clinical trials. All figures discussed in this section are derived from BIO’s 2021 clinical trial analysis, a truly excellent read if you’d like to learn more.
If our hypothetical drug managed to clear clinical trials, it’s time to enter the market. We then need to forecast drug pricing, market share and total addressable market. We also need to assess duration of the exclusivity period, after which sales will decline due to competition from biosimilars or generics. The US is generally the most lucrative market, typically accounting for approximately 50% of the NPV and it’s common practice to focus on the US market. Sometimes a x2 multiplier is applied to the NPV to account for ex-US sales. For estimating drug pricing, existing competitors will often provide a useful price anchor - with the potential for pricing premiums if the new drug is truly differentiated. The market share is a key driver for the valuation, but is also one of the more complex ones to estimate. Because of the timelines involved, you don’t just need to account for the drugs that are on the market today and how your treatment will stack up against those, but you also need to account for drugs that are currently in trials or slated to enter trials in the near future. First-in-class medicines have an advantage at first and can often retain significant market share when there’s no real differentiation among products. Conversely, when later products are truly differentiated, best-in-class medicines, they can overcome their later start to achieve significant marketshare. Unfortunately, just knowing that doesn’t help us too much; it mostly shifts the question from “how much market share will this product capture” to “can we accurately forecast relative efficacy and safety for multiple products and trials”. Given how challenging predicting even a single trial is, the answer to the latter is probably “no”, at least not with any real confidence in our estimates. Nevertheless, we will give it our best shot.
Patents generally last around 12 years after initial approval. After this period, drugs need to contend with either biosimilars (for large molecules) or generics (for small molecules), leading to price and market share erosion. Much has been written about the US’ Inflation Reduction Act (IRA) and its impact on pricing for small and large molecules. We’re not accounting for this explicitly in our model, but for select drugs the US government can negotiate a maximum fair price with the manufacturer after 9 (small molecules) or 12 (large molecules) years, adjusting the price downwards.
Thus far we’ve mostly looked at the sales part of the equation; let’s turn our attention to some of the costs involved. In order to have something to sell, we need to actually produce it first. This is associated with a certain cost, dubbed the Cost of Goods Sold (COGS). These vary per modality, with small molecules featuring well-understood synthesis processes and a generally low COGS (10-20% of revenue), followed by antibodies (15-25%) and cell/gene therapy where manufacturing poses unique challenges (25-40%). We also need to account for general operating expenses (OPEX), which usually amounts to 30-50%. We top it all off with a tax rate (usually around 20%, though this can be reduced through R&D tax credits).
Finally, we need some way to fund this research. The Weighted Average Cost of Capital (WACC) is the average rate of return expected by investors, based on the mix of debt and equity financing used (WACC = (E/V x Re) + ((D/V x Rd) x (1 – T)), where E/V is percentage of capital that is equity, D/V percentage of capital that is debt, Re the cost of equity, Rd the cost of debt and T the tax rate) . Early-stage biotechs generally primarily rely on (dilutive) equity financing, through debt can also be used to extend runway or bridging bad market periods. Equity financing is generally more expensive than debt financing, resulting in a relatively high WACC for biotechs, often 8-12%. This also helps explain why biotech as a sector is so sensitive to interest rates. A large amount of capital is required up-front to pay for research and development, while prospective revenues are usually at least a decade removed from trial initiation. There’s a significant opportunity costs associated with locking up capital for over a decade - investors could earn a return on that capital from investing in other businesses, in bonds, etc. When interest rates are high, even a simple US treasury bill can earn 4-5% on a yearly basis with minimal risk (returns on treasury bills are a close approximation of the risk-free rate Rf, essentially compensation for the time value of money). This is captured in the capital assets pricing model (Re = Rf + Beta * ERP). Beta is a measure of the asset’s systemic risk (often hard to estimate for early biotechs), while ERP is the equity risk premium - compensation for participating in capital markets.
Enter the agent
Phew - that’s a lot of parameters. Let’s return to our agent and provide it with the instructions it needs to research all of these. I’ve set up a skill in the .claude folder, which guides Claude Code through the basics of researching all of these parameters. Skills are essentially structured workflows that Claude can execute, helping keep the AI on track for longer, more challenging tasks. They help avoid the AI getting sidetracked or forgetting to do certain things. You start off with some frontmatter including the name, a short description and the tools it can use, after which the file describes the steps it should follow to successfully execute the workflow. A short sample from the biobucks skill:
---
name: biobucks
description: Generate comprehensive DCF (Discounted Cash Flow) valuations for biotech assets with AI-powered market research. Use when the user wants to value a biotech asset, create a DCF model, analyze drug development economics, or assess therapeutic area market potential. Triggers include mentions of valuation, DCF, biotech asset analysis, drug pricing, market research, clinical trial costs, or NPV/IRR calculations.
allowed-tools: WebSearch, WebFetch, Read
---

# Biotech DCF Valuation Skill

This skill generates comprehensive Discounted Cash Flow (DCF) valuations for biotech assets by researching current market data, pricing, clinical trial costs, and development timelines using web search, then structuring all parameters needed for financial modeling.

## Reference Data

This skill includes a curated reference dataset with clinical phase transition probabilities and trial costs:

**File**: `clinical_trial_reference_data.json` (in the same directory as this SKILL.md)

**Contents**:
- Phase transition probabilities by therapeutic area (12 areas) from BIO/QLS Advisors and Wong et al.
- Clinical trial costs by phase and therapeutic area from ASPE/HHS and DiMasi et al.
- Per-patient costs by therapeutic area and modality
- Indication-specific data for high-value indications (Alzheimer's, breast cancer, NSCLC, T2D, RA, MS, etc.)
- Adjustment factors for biomarkers, orphan drugs, breakthrough designations, etc.

**Usage**: Load this file at the start of each valuation to get baseline values. Then search for more specific/recent data to refine the estimates. The reference data provides well-sourced defaults; web search should be used to find indication-specific or more current information.

## Instructions

When a user requests a biotech valuation, follow these steps systematically:

### Step 1: Gather Asset Information

Collect the following details about the asset (ask if not provided):
- **Asset name**: Drug/therapy name or target indication
- **Therapeutic area**: Disease category (oncology, rare disease, CNS, etc.)
- **Mechanism of action**: How the drug works (e.g., "anti-PD-1 antibody", "CRISPR gene therapy")
- **Modality**: Drug type (small molecule, antibody, gene therapy, cell therapy, etc.)
- **Current development stage**: The asset's position in development. Use these options:
  - **"Phase I Ready"**: Ready to start Phase I trials
  - **"Phase II Ready"**: Phase I complete, ready to start Phase II trials
  - **"Phase III Ready"**: Phase II complete, ready to start Phase III trials
  - **"Registration Ready"**: Phase III complete, ready for regulatory submission
  - **"Approved"**: Regulatory approval obtained
- **Biomarker status**: Ask the user about biomarker-driven patient selection
What it produces in the end is a - hopefully - well-researched json file, describing for each parameter outlined above 1) the actual value 2) its reasoning and 3) the sources it used to arrive at that conclusion. Because the structure of a DCF is quite consistent across indications and modalities, I opted to have the skill not handle that part, but rather offload it to a simple python script that visualizes everything and handles the actual calculation.
Putting it all in practice
That was a pretty long-winded explanation. Let’s get to the fun part and take a look at all this in action! As an example, I’ve asked it to provide me with a DCF model for a small molecule NLRP3 inhibitor, ready to go into Phase I studies for Parkinson’s disease. As expected, Claude takes a few minutes to research the database file and adjust that based on more recent/more specific information for this case. Then, it launches the server and shows the DCF with development phases, costs, expected revenues and the risk-adjusted net present value of all of those. The total estimated value of this asset at Ph I outset is just over $100MM.
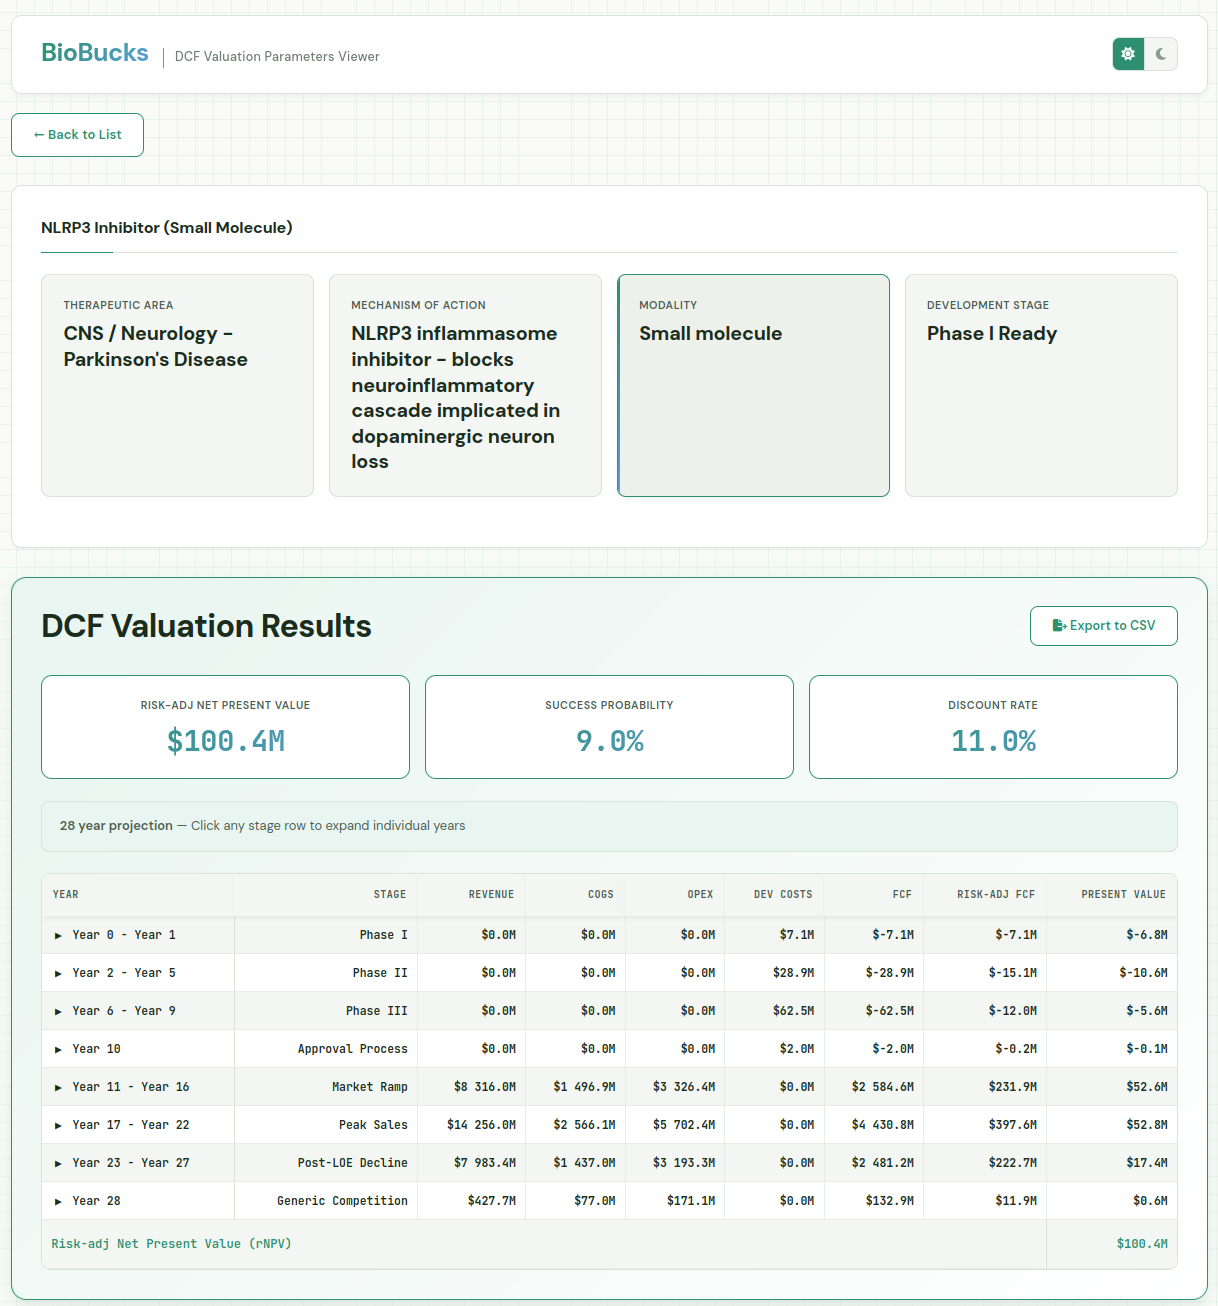
As mentioned earlier, the model was asked to provide its reasoning and sources, allowing us to inspect and fine-tune. The probability of success for the asset is 9% over all three phases. That may be somewhat on the high side, that there’s currently no disease modifying treatments for Parkinson’s. We can go in and adjust the Phase II success rate from 34 to 20%, resulting in an rNPV of 51MM. On the flip side, we could be very optimistic about the potential for NLRP3 compounds and feel it’s 50% likely to succeed in Phase II, which would increase the rNPV to $154MM.
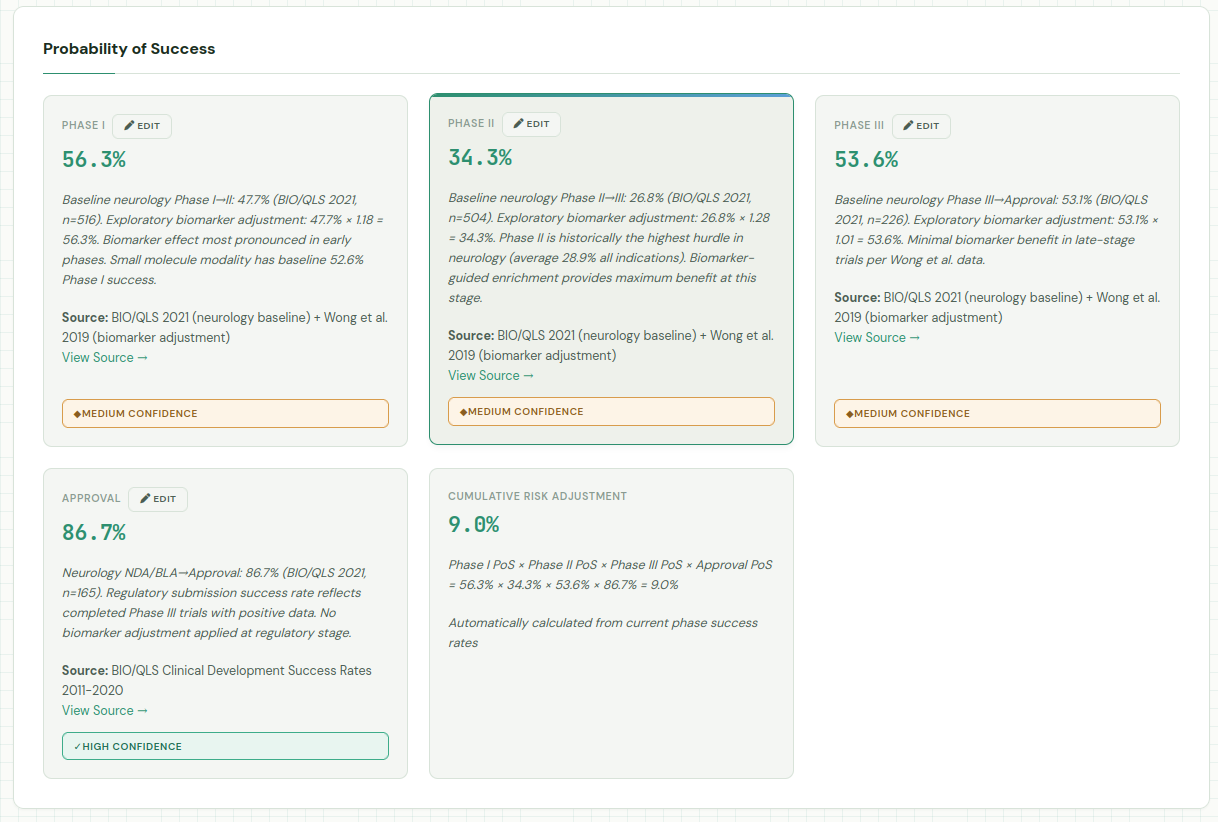
Claude also provides some metadata in the json, including its notes from running the research. Combined with the confidence levels in each of the individual parameters, this can provide some guidance on wich assumptions to validate first.
Generated: January 19, 2026
Currency: USD
 Notes: All dollar values in USD and market scope is United States only. Confidence levels: High (authoritative source from within 2 years), Medium (authoritative source 2-5 years old or recent indirect source), Low (estimated, extrapolated, or >5 years old). This research provides inputs for DCF modeling. Users should validate assumptions and adjust based on specific asset characteristics. Key uncertainties: (1) NLRP3 competitive landscape rapidly evolving, (2) Disease-modifying endpoint validation in PD remains challenging, (3) Biomarker adjustment data from oncology may not fully translate to CNS.
It’s hard to say whether this estimate is “correct” or even realistic. After all, as the old adage goes “It is difficult to make predictions, especially about the future”. Drug sales forecasts are notoriously hard when you are forecasting out from just before launch, let alone when you need to peer more than a decade into the future. At this stage they are much more about obtaining a general sense of direction than an actually accurate number. A sensitivity analysis (beyond the scope of today’s post) would be very useful to test which parameters have an outsized impact on the total valuation. It should also be noted that DCFs are also only a single tool and should be combined with other methods such as the VC valuation method, real option method or simple comparison to similar assets. All these caveats aside, we need to start somewhere to enable investments; perhaps with sufficient advances in data and AI we can some day get better at this.
While I was putting this post together, Insilico Medicine (ISM) just announced a $66MM deal with Hygtia for 50% of the rights to its brain-penetrant NLRP3 inhibitor, which will be looking to enter trials for PD in the near future. It’s worth noting that only $10MM of the total 66 is upfront with the rest tied to milestones, and that Hygtia will be footing the bill for trials beyond Ph I, which makes for a somewhat more complex financial picture. Nevertheless, it looks like our $100MM estimate is at least in a reasonable ballpark.
Overall I think agents show a lot of promise when it comes to research work like this, though much hinges on individual model quality and how well they listen to instructions. I hope you enjoyed reading this post as much as I did writing it!